 Summary
 Summary
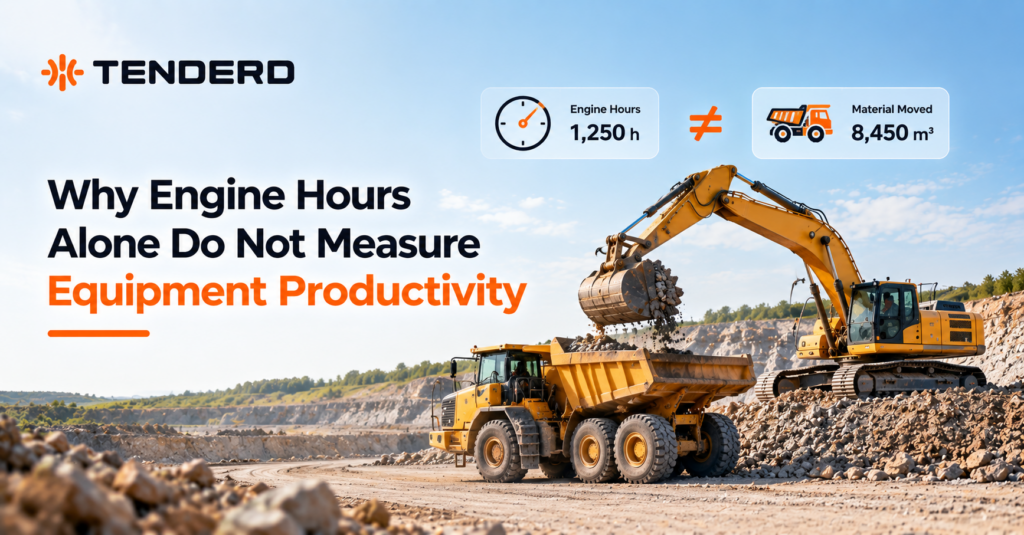
Engine hours measure how long a machine’s ignition was on, not how much work it did. An excavator idling for three hours while it waits for a truck logs the same engine hours as one digging for three hours. To measure equipment productivity, you need two more layers: utilization (time the machine was actually working, such as hydraulics engaged or blade down) and output (what that work produced, such as material moved or distance compacted). Engine hours still matter, but for maintenance and billing, not performance.
Key Takeaways
- Engine hours count running time, not working time. Every minute of idling, warm-up and waiting is logged exactly like productive work, so high hours can hide low output.
- Productivity has three layers. Running (ignition on), working (the machine doing its job) and producing (measurable output). Engine hours only capture the first.
- The right productivity measure depends on the machine. Hydraulics activated time for a loader, arc-on time for a welder, load percentage for a generator, distance compacted for a roller. One hour meter cannot represent all of them.
- Engine hours are not useless. They remain the correct basis for hour-based maintenance and many rental contracts. The mistake is using them to judge performance.
Introduction
Ask most equipment managers how hard their fleet worked last month and the answer usually starts with the hour meter. It is the number every machine already records, it shows up on rental invoices and service schedules, and it is easy to compare across a fleet.
The problem is what it leaves out. On a busy GCC site, a dozer can sit with its engine running while a survey crew finishes setting out. A loader can wait in a queue for trucks that are stuck at the gate. In the summer, operators often keep the engine on between tasks simply so the cab stays cool. All of that time lands on the hour meter, and none of it moves the project forward.
This article explains where engine hours fall short, what to measure instead, how the right measure changes from one equipment type to the next, and where engine hours still earn their place.
What Engine Hours Actually Measure
Engine hours (also called hour meter readings, ignition hours or running hours) record the cumulative time a machine’s engine or ignition was switched on. That is all they record.
They do not distinguish between:
- A machine working at full load and one sitting at idle
- An excavator digging and an excavator waiting for a dump truck
- A crane lifting a load and a crane parked with the engine running between lifts
- A generator powering a site at 80% capacity and one running on standby with almost no load
Because of this, engine hours are a measure of exposure, how long the machine was available to wear, burn fuel and accrue cost. They are not a measure of contribution.
The Three Layers of Equipment Productivity
A more useful way to think about equipment performance is as three separate layers, each answering a different question.
- Running: Was the machine switched on?
This is ignition time, the layer engine hours already cover. It tells you the machine was available and consuming fuel.
- Working: Was the machine doing its actual job?
This is utilization. It depends on a signal that only appears when the machine is working: hydraulics pressurized on an excavator or loader, the blade engaged on a dozer or grader, the boom raised on a man lift, the arc struck on a welding machine. The gap between layer 1 and layer 2 is, for practical purposes, idle time.
- Producing: What did that work achieve?
This is productivity in the strict sense: material moved per day by a dump truck, distance compacted by a roller, distance paved by an asphalt paver, loads carried by a forklift, kWh generated by a generator.
Engine hours sit entirely in layer 1. A machine can score well there and poorly in the two layers that actually determine whether a project stays on schedule.
| Metric | Excavator A | Excavator B |
|---|---|---|
| Engine hours (ignition on) | 10 hrs | 10 hrs |
| Hydraulics activated time | 7.5 hrs | 4 hrs |
| Idle time (engine on, not working) | 2.5 hrs | 6 hrs |
| Utilization of ignition time | 75% | 40% |
On an engine-hours report, these two machines look identical. In reality, Excavator B spent most of its shift burning fuel and accumulating service hours without digging. The cause could be anything: a truck shortage, a poorly sequenced work front, an operator on extended breaks with the engine left running, or simply a machine that is not needed on that site and should be reassigned.
None of those causes is visible from the hour meter. All of them are visible once working time is measured separately from running time.
Why the Right Productivity Metric Depends on the Machine
The second limitation of engine hours is that they apply one definition of “worked” to every asset. Mixed heavy-equipment fleets do not work that way. A crane, a generator and a pickup truck do fundamentally different jobs, so “productive” has to mean something different for each.
TENDERD’s Productivity module is built around this idea. Below is how utilization and productivity are defined for a selection of common equipment types:
| Equipment | What counts as working (utilization) | What counts as output (productivity) |
|---|---|---|
| Excavator | Bucket/boom activation; operating hours vs idle hours | Number of cycles (bucket loads) per shift; volume of earth moved per hour |
| Wheel loader / skid steer | Bucket activated vs idling | Bucket activated (operating) hours vs idle hours |
| Bulldozer | Blade engaged vs idle | Dozing distance over a specified area and time |
| Motor grader | Blade engaged vs idle | Distance graded |
| Crane | Ignition on/off; idling time with no payload | Engagement time (hooking, unhooking, working); time on hook vs off hook |
| Dump truck (tipper) | Payload trips; number of tipping activities | Tons or cubic meters of material transported per day |
| Ride-on roller / PTR | Moving time vs total ignition time | Distance compacted |
| Asphalt paver | Auger activated time vs total ignition time | Distance paved |
| Forklift | Lifting hours vs total engine or battery hours | Loads carried (tons); load/unload cycle times |
| Generator | Running vs standby hours; load percentage | Power output over time (kWh); fuel consumption rate vs output |
| Air compressor | Dispensing rate (running vs idle) | Dispensing time |
| Welding machine | Arc rate (% arcing activity) | Arc-on time vs total shift time |
Generators. A generator’s running hours say almost nothing about whether it is doing useful work. One running at a fraction of its rated load all day logs the same hours as one fully loaded. Load percentage and kWh output reveal whether the unit is oversized, underused or a candidate for consolidation.
Welding machines. A welder can be switched on for a full shift with only a fraction of that time spent actually arcing. Arc-on time against total shift time is the number that reflects welding output; running hours do not.
How Working Time is Captured
Measuring layers 2 and 3 requires signals that engine hours do not provide. In practice, the input depends on the equipment:
- GPS movement for road vehicles, trailers, water tankers and truck-mounted cranes, where moving time is the meaningful work signal
- Pressure sensors on hydraulic equipment such as excavators, loaders, backhoes, forklifts and piling rigs, to detect when the hydraulics are actually engaged
- Pressure sensors or reed switches to detect blade activation on dozers and graders
- Proximity sensors on man lifts, scissor lifts and boom lifts to detect platform or boom activation
- Reed switches on welding machines to detect arcing
- CT coils on generators and distribution boards to measure current, voltage and load
- Axle load or pressure load sensors on dump trucks to measure material moved
The point is not the hardware itself. It is that “productive” is defined by what the machine is physically doing, and the measurement has to come from that activity, not from the ignition switch.
Where Engine Hours Still Belong
Maintenance scheduling. Engines, filters and fluids wear with running time, including idle time. Hour-based service intervals are the correct way to plan preventive maintenance, and TENDERD’s Maintenance module triggers schedules on hourmeter and machine data for exactly this reason.
Rental and contract billing. Many rental agreements are billed on hours or on availability. Engine hours give a defensible record for those agreements.
Asset lifecycle and resale. Total hours remain a standard input into depreciation, disposal timing and resale value.
Idle cost. Because engine hours include idling, comparing them against working hours is how you find idle cost in the first place.
In other words, engine hours tell you what a machine has cost you in wear and fuel. Utilization and productivity tell you what it gave back.
The Hidden Cost of Managing on Engine Hours
When engine hours are the main performance KPI, a few patterns tend to follow.
Idle time is rewarded. A machine with high engine hours looks busy. The fleet appears fully utilized on paper while a large share of those hours produced nothing.
Fleet sizing decisions go the wrong way. Site teams request additional machines because the existing ones appear fully booked by hours. In reality, the shortage is in working time, not machine count, and the same fleet can have some machines overloaded while others sit underused.
Emissions and fuel are misattributed. Fuel burned at idle produces emissions without any output. Without separating working from idle time, there is no way to see how much of a fleet’s fuel and CO2 is recoverable.
Maintenance cost per unit of work rises unnoticed. An excavator that idles for half its shift reaches its service interval in half the productive time, so maintenance spend per cubic meter moved effectively doubles.
What Changes When Productivity Is Measured Properly
AD Ports. AD Ports runs high-volume port operations around the clock across multiple terminals. As those operations scaled, the team faced a familiar mix of problems: some equipment underused, other equipment overloaded, no real-time efficiency data, disconnected operations across locations, and excessive fuel consumption and emissions caused by idling.
TENDERD now monitors 172 machines across AD Ports’ operations in real time. Engine on time and idling time are tracked as separate figures for every asset, so the gap between running and working is visible machine by machine. Engine hours were not discarded in the process: hour meter, odometer and engine days continue to drive periodic maintenance schedules, which is exactly the job they are suited to.
With running time and working time finally separated, AD Ports could identify over- and under-utilized machines and redistribute the fleet accordingly. The results:
- 30% improvement in equipment utilization
- 24% decrease in equipment idling time
- 763,000 liters per year reduction in fuel consumption
- 2,000 tonnes of CO2 emissions reduced annually
None of these outcomes would show up on an engine-hours report. A machine that idles less and works more can log similar hours; the difference only becomes visible when idle time is measured on its own.
How TENDERD’s Productivity Module Measures Beyond Engine Hours
The Productivity module tracks all three layers side by side, so engine hours are kept in context rather than replaced.
Ignition and utilization shown together. The Dashboard reports Ignition on hours and Utilisation hours as separate totals, broken down by shift, with a daily chart of utilization versus idling. The gap between the two is the idle time worth chasing.
Benchmarked against your own targets. Average utilization is shown per machine category against a target, marked Above target or Below target, so a percentage becomes a clear verdict rather than a number that needs interpretation.
Productivity defined per equipment type. The Machines tab lists every enrolled asset with Ignition On, Utilization, Productivity and Productivity per day, where productivity follows the equipment-specific definitions in the table above. Productivity per day normalizes output across machines with different active time, making them comparable.
Hour-by-hour view for any machine. The Graphs tab shows an hourly bar chart per machine, green for utilized hours and red for idle, sorted by utilization. It makes patterns like long morning warm-ups, extended lunch-break idling or late-shift dead time easy to spot across many assets at once.
Evidence behind the number. On AI Camera equipped assets, the footage behind a productivity figure can be opened directly, which helps settle disagreements about equipment performance with evidence.
The same working-versus-idle split feeds the rest of the platform. Track shows idle clusters on a heatmap, Emissions isolates idling emissions as the most recoverable category, and TENDERD’s AI watches for idle equipment continuously and escalates when a pattern repeats, so an underused machine reaches someone who can reassign it.
Best Practices for Measuring Equipment Productivity
Report running, working and producing separately. Keep engine hours on the report, but never as the only column. The idle gap is the most actionable number on the page.
Match the metric to the machine. Agree, per equipment type, what “working” and “output” mean before setting targets. Arc time for welders and load percentage for generators will produce better decisions than hours ever will.
Set targets per equipment category, not fleet-wide. A 60% utilization target may be ambitious for a crane and too low for a dump truck. Category-level targets make above and below target meaningful.
Review by shift and by hour. Daily totals hide patterns. Hourly views reveal whether idle time is concentrated in specific shifts, crews or times of day.
Use the idle gap before approving new equipment. Before renting or buying another machine, check the utilization of the ones already on site. Reallocation is usually cheaper than acquisition.
Keep engine hours for maintenance and billing. Hour-based service intervals and contract records should continue to run on the hour meter.
Limitations to Be Aware Of
Sensors are required for most heavy equipment. Ignition and GPS data are enough for road vehicles and movement-based assets, but measuring work on hydraulic, lifting and electrical equipment needs the appropriate sensor fitted.
Not every equipment type has a distinct output metric. For some assets, such as piling rigs, man lifts and distribution boards, utilization is the primary measure and no separate output metric is currently defined.
Targets need to be realistic. A utilization target set without reference to the type of work, site conditions or project phase will generate noise rather than insight.
Data needs action. Measuring idle time does not reduce it on its own. The value comes from the reallocation, scheduling and operator conversations that follow.
The Bottom Line
Engine hours answer one question well: how long has this machine been running? They cannot tell you whether it was digging, lifting, compacting or simply waiting. For mixed heavy-equipment fleets, where a crane, a generator and an excavator each define “productive” differently, relying on the hour meter means managing on exposure rather than output.
The fix is not to discard engine hours but to put them alongside the two measures that actually reflect performance: working time and output, defined for each type of machine. That is where idle cost, unnecessary rentals and recoverable emissions become visible.
If your fleet reports are still built around hour meter readings, it is worth seeing what the same machines look like when running, working and producing are measured separately. Book a demo of TENDERD Productivity to see utilization, idle time and equipment-specific productivity on your own fleet.
Frequently Asked Questions
Are engine hours the same as utilization?
No. Engine hours count the time the ignition is on. Utilization counts the time the machine is doing its actual job, such as hydraulics engaged on an excavator, blade engaged on a dozer or arcing on a welding machine. The difference between the two is mostly idle time.
What is the difference between equipment utilization and productivity?
Utilization measures how much of the available time a machine spent working. Productivity measures what that work produced, such as material moved, distance compacted, loads carried or arc-on time. A machine can be well utilized and still produce less than expected.
Should engine hours still be tracked?
Yes. Engine hours remain the right basis for hour-based service intervals, warranty records and many rental agreements. They are a wear and maintenance measure, not a performance measure.
How is productivity measured on equipment that does not move, like generators or welding machines?
Through machine-specific signals. A generator is measured on running versus standby hours, load percentage and power output in kWh. A welding machine is measured on arc rate and arc-on time versus total shift time. Engine or running hours alone say nothing about either.
Do you need extra sensors to measure productivity beyond engine hours?
For most heavy equipment, yes. Ignition and GPS data cover road vehicles and movement-based assets, but measuring work on hydraulic, lifting and electrical equipment requires the right input, such as a pressure sensor on the hydraulics, a reed switch on a welder or a CT coil on a generator.