 Summary
 Summary
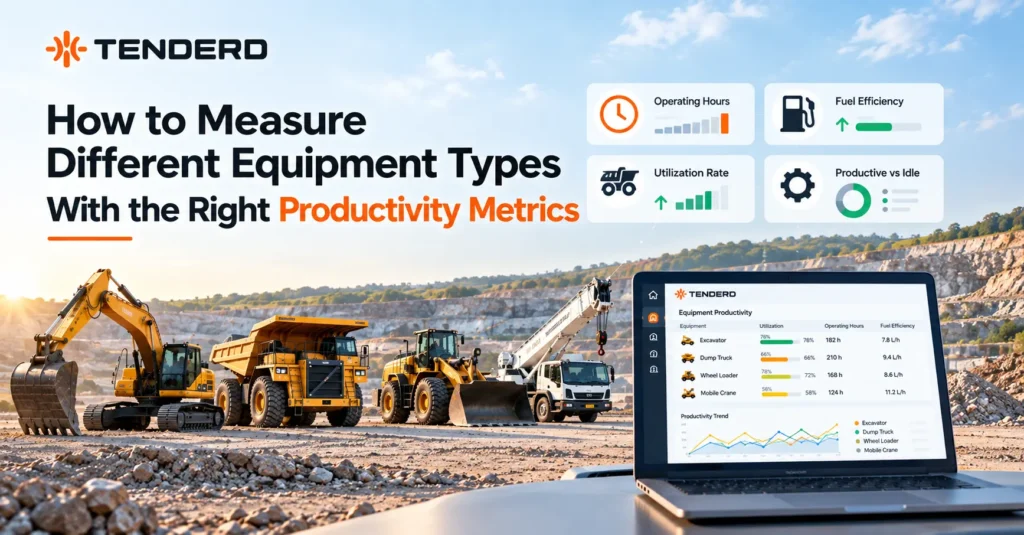
Different equipment types need different productivity metrics because “working” means something different for each machine. A dump truck’s productivity is material moved per day, a crane’s is engagement or hook time, a welding machine’s is arc-on time, and a generator’s is power output against load. Measuring every asset in a fleet against the same utilization percentage hides which machines are actually earning their keep and which ones just have their engines running.
Key Takeaways
- Utilization and productivity are not the same measurement. An ignition switched on tells you a machine was running, not that it did any work.
- Every equipment category needs its own productivity definition. A crane’s output looks nothing like a paver’s or a welding machine’s, and scoring them against the same number erases the difference between a hardworking machine and an idle one.
- A single fleet-wide utilization percentage hides more than it reveals. On the Abu Dhabi SeaWorld project, ALEC’s mixed fleet of 130 assets across 17 subcontractors improved utilization by 25 percent and cut downtime by 34 percent once equipment was benchmarked by category instead of as one blended number.
- Getting this right changes real decisions. Declining a rental renewal, redeploying an idle machine instead of buying another, and setting a fair bonus scheme all depend on measuring the right thing for the right piece of equipment.
Introduction
A fleet manager checking a dashboard sees one number: utilization at 68 percent. It sounds like a workable figure until someone asks a harder question. Sixty-eight percent of what, exactly? A truck’s 68 percent and a crane’s 68 percent are not measuring the same behavior, and neither is telling the manager what they actually need to know, which is whether the machine did any productive work or simply sat there with the engine idling.
This confusion is common on mixed fleets, and it gets worse as the fleet gets more varied. A construction site running trucks, cranes, generators, welding machines, and compactors side by side cannot honestly reduce all of them to one utilization score. A truck’s job is to move material from one place to another. A generator’s job is to supply power at a usable load. A welding crew’s job is measured in arc-on minutes, not engine hours. Treating them identically does not simplify reporting, it just makes the reporting wrong.
This article works through why equipment type changes what “productive” means, how a fleet management platform actually measures that difference machine by machine, and what the right metric looks like across the equipment types most common on construction, oil and gas, and industrial sites in the UAE and wider GCC. It also covers where this gets hard to do consistently and what a practical rollout looks like.
What is Equipment Productivity Measurement?
Equipment productivity measurement is the practice of tracking whether a machine performed useful work during the time it was available, using a definition of “useful work” specific to that machine’s function, rather than a single blanket measure applied across an entire fleet.
It sits one layer below utilization. Utilization typically answers “was this machine running or available,” commonly expressed as ignition-on hours against total available hours. Productivity answers a more demanding question: of the time the machine was on, how much of it was spent doing the thing it exists to do. A machine can be highly utilized and still low on productivity, an engine left idling for hours counts toward utilization but produces nothing.
In TENDERD’s platform, this distinction sits in the Productivity module. It measures utilization and output differently depending on the equipment category it is looking at, then benchmarks each category against a target so a raw number turns into an immediate above-target or below-target verdict, rather than a figure a manager has to interpret on their own.
How does Equipment-Specific Productivity Measurement Work?
Mechanically, this comes down to matching the sensing method to what actually constitutes work for a given machine.
For assets that move between locations, like trucks, water tankers, and trailers, GPS-based distance covered is a reasonable stand-in for productive output: distance travelled correlates with material or people actually being transported somewhere. For assets that do work in place, like cranes, excavators, loaders, and welding machines, distance is meaningless, since the machine may never move while doing its most productive hour of the day. These require hydraulic activation, boom or bucket engagement, or arc activity to be read directly off the equipment.
For power-generating assets, like generators, the measurement shifts again, to load percentage and output over time rather than motion or engagement at all. A generator running at 10 percent load for eight hours has burned fuel and logged ignition-on hours without doing much useful work, and only a load-and-output view catches that.
Once the right signal is captured for each equipment type, the platform benchmarks it against a target set for that category, and surfaces the gap between ignition-on time and genuine productive use. That gap is where idle cost hides: rental, depreciation, fuel, and maintenance all accrue whether or not the machine is working, and the gap between “on” and “productive” is the part nobody sees without measuring it directly.
Why Equipment Type Changes the Right Metric
A single utilization percentage assumes every machine on a fleet does the same kind of work. In practice, equipment falls into a few distinct categories, and each one needs a different lens.
Machines that produce distance. Trucks, water tankers, flatbeds, and rollers are productive when they are moving with a purpose, whether that is transporting material, delivering water, or compacting a surface. Distance travelled or distance compacted is a direct, defensible output measure for this category.
Machines that produce engagement time. Cranes, excavators, loaders, and backhoes do work through hydraulic or mechanical activation rather than movement across the ground. A crane parked in one spot for a full shift, hooking and unhooking loads continuously, is far more productive than one driving between two sites without lifting anything. Engagement time, hook time, or hydraulics-activated time captures that.
Machines that produce a countable output. Excavators and dump trucks can be measured by volume of material moved or cubic meters transported per day, giving operations and finance a number that ties directly to project progress rather than just machine behavior.
Machines that produce power or a process rate. Generators are productive based on load and output, not runtime. Welding machines are productive based on arc-on time as a share of the shift, not how long the machine was powered up. Air compressors are similar: dispensing time matters more than total ignition-on time.
Machines where utilization is close to the whole picture. For a small number of equipment types, such as distribution boards or man lifts, there is no strongly distinct output measure beyond how much of the available time the equipment was actively engaged. For these, utilization itself, measured correctly, is the productivity signal.
None of these categories is more important than the others. The point is that forcing them into one metric produces a number that is technically accurate and operationally useless.
The Right Productivity Metric by Equipment Type
The table below reflects how TENDERD’s Productivity module measures utilization and output differently across common equipment categories on construction, oil and gas, and industrial fleets.
| Equipment | Utilization Metric | Productivity Metric |
|---|---|---|
| Crane | Ignition on/off; idling time with no payload | Engagement time (hooking, unhooking, working); time on hook versus off hook |
| Excavator | Bucket or boom activation; operating hours versus idle hours | Volume of material excavated per hour; number of bucket cycles per shift |
| Dump Truck (Tipper) | Payload trips versus total available hours; number of tipping activities | Cubic meters or tons of material transported per day |
| Generator | Running hours versus standby hours; load percentage | Power output over time (kWh generated); fuel consumption rate against output |
| Welding Machine | N/A | Arc rate; arc-on time versus total shift time |
| Wheel Loader / Skid Steer Loader | Bucket activated or idling | Bucket-activated time; operating hours versus idle hours |
| Bulldozer | Engine hours versus available hours; blade engaged versus idle time | Dozing distance; efficiency of leveling and dozing over a defined area and time |
| Motor Grader | Blade activation or idling | Graded distance |
| Asphalt Paver | Auger-activated percentage of total ignition time | Distance paved |
| Backhoe Loader | Boom or bucket activated; operating versus idle | Boom or bucket activated hours |
| Ride-On Roller / Compactor | Movement percentage: moving time against total ignition time | Distance compacted |
| Forklift | Actual lifting hours versus total engine or battery hours | Loads carried (tons); load and unload cycle times |
| Road Vehicles, Water Tankers, Flatbeds | Movement percentage: moving time against total ignition time | Distance travelled |
A pattern worth noticing: for roughly half of these equipment types, the productivity metric is not a percentage at all. It is distance, volume, cycles, or arc time, an operational unit that means something to a site supervisor without translation. That is the point of measuring by category rather than by a single utilization score.
Equipment Productivity in Construction and Oil and Gas
This distinction matters more in some sectors than others, and construction and oil and gas sit near the top of that list for a simple reason: both routinely run large, mixed fleets across multiple sites, often with owned, rented, and subcontractor equipment mixed together.
On a construction site, a single day of operations might involve excavators, dump trucks, a tower crane, a concrete pump, and a welding crew, all reporting to the same project schedule but doing entirely different kinds of work. A generic utilization report averaged across that mix produces a number nobody on site would recognize as meaningful, and it obscures exactly the kind of underperformance a project manager needs to catch early, like a crane sitting mostly idle while trucks queue up waiting for it.
Oil and gas and industrial sites add another layer: equipment that is stationary but still central to the operation, like generators and distribution boards powering a remote site, and process equipment like compressors and welding rigs supporting a shutdown or turnaround. Measuring these by movement or ignition time alone would tell a plant manager almost nothing about whether the equipment was doing its job.
Multi-subcontractor sites compound the problem further. When 17 subcontractors bring their own mixed equipment onto one project, as was the case on the Abu Dhabi SeaWorld development that ALEC managed with TENDERD, there is no way to get an honest utilization picture without a consistent, category-aware measurement standard applied to all 130 assets regardless of who owns them. That consistency is what allowed the project to identify underused equipment and improve overall utilization by 25 percent while cutting downtime by 34 percent.
Challenges and Limitations
Sensor coverage has to match the equipment. A distance-based metric needs reliable GPS. A hydraulic engagement metric needs a pressure or activation sensor wired into the right system. Equipment brought on site by a subcontractor without the right sensing hardware installed will not produce a usable productivity figure until it is fitted, which is a practical rollout step, not a data problem.
Targets need a baseline before they mean anything. Benchmarking a category as above or below target only works once there is enough historical data on that category, in that operating context, to set a realistic target. A target imported from a different site or project type can flag a well-performing machine as underperforming simply because the comparison is wrong.
Not every equipment type has a distinct output metric yet. For a small number of categories, particularly stationary or single-function equipment, utilization is currently the best available signal, and a distinct productivity measure has not been defined. This is worth stating plainly rather than forcing a number where none exists.
More categories add more complexity to reporting. A fleet-wide dashboard with a dozen different productivity definitions is more accurate than one blended percentage, but it also asks more of the person reading it. This is where category-level benchmarking against a visible target, rather than a raw number, does the work of making the data usable at a glance.
Best Practices for Implementation
Start by inventorying equipment types, not just equipment count. Group the fleet by category, not by asset ID, and identify which categories are currently being measured by a generic utilization number that does not reflect their actual work.
Confirm sensor coverage before setting targets. A GPS-only device cannot report hydraulic engagement, and a target set against data the equipment cannot actually produce will be wrong from day one.
Set targets per category, not per fleet. A single fleet-wide utilization target treats a generator and a crane as comparable, which they are not. Category-specific targets, built from that category’s own historical performance, are what make an above-target or below-target reading meaningful.
Separate ignition-on time from productive time in every report. The gap between the two is where idle cost lives, and reporting them together as one number hides exactly the waste a fleet manager is trying to find.
Review by category on a regular cadence, not just fleet-wide. A fleet average can look healthy while one category, such as cranes on a specific site, is quietly underperforming. Reviewing category by category, and drilling into a single machine’s hour-by-hour record when something looks off, catches that before it becomes a pattern.
Extend the same standard to subcontractor equipment. Mixed ownership should not mean mixed measurement standards. Applying the same category-based metrics to owned, rented, and subcontractor equipment is what makes utilization comparisons across a multi-contractor site honest in the first place.
Utilization Alone vs. Category-Specific Productivity Measurement
| Comparison Area | Utilization Alone | Category-Specific Productivity |
|---|---|---|
| What it measures | Ignition-on time against available time | The specific output each equipment type exists to produce |
| Crane | A single percentage, regardless of whether the crane was lifting or idling | Engagement time and hook time, separating active lifting from standing idle |
| Generator | Running hours, regardless of load | Power output against load, catching a generator running under near-zero load |
| Welding machine | Rarely tracked meaningfully at all | Arc-on time as a share of the shift |
| Mixed-fleet comparison | Misleading, since every equipment type is forced into the same measure | Honest, since each category is benchmarked against its own target |
| Decision usefulness | Tells you a machine was on | Tells you whether the machine actually did its job |
The Bottom Line
The instinct to reduce a fleet to one utilization number is understandable. It is easier to report and easier to compare. It is also, for anything but a single-equipment-type fleet, close to meaningless. A crane, a generator, a welding machine, and a dump truck each do fundamentally different work, and measuring all of them the same way tells a fleet manager almost nothing about which machines are actually earning their keep.
Getting this right is what let ALEC identify real under-utilization across 130 pieces of equipment from 17 subcontractors on the Abu Dhabi SeaWorld project, improving utilization by 25 percent and cutting downtime by 34 percent, gains that only became visible once each equipment category was measured on its own terms and benchmarked against its own target.
If your fleet reporting currently stops at one utilization percentage across every machine type, it’s worth seeing what category-specific productivity measurement looks like on your own equipment mix. Book a demo of TENDERD to see how the Productivity module benchmarks cranes, trucks, generators, and the rest of a mixed fleet, each against the metric that actually applies to it.
Frequently Asked Questions
What is the difference between utilization and productivity for equipment?
Utilization measures whether a machine was running or available, typically as ignition-on hours against total available hours. Productivity measures whether that time produced useful output, defined differently for each equipment type, such as distance travelled for a truck or arc-on time for a welding machine.
Why can't I just use one utilization percentage for my whole fleet?
Because “productive” means something different for every equipment category. A single percentage applied fleet-wide treats a crane's engagement time the same as a truck's distance travelled, which erases the distinction between a machine that is actually working and one that is simply switched on.
How do you measure productivity for equipment that doesn't move, like a generator or welding machine?
Through activity signals other than distance: load percentage and power output over time for generators, and arc-on time as a share of the shift for welding machines. Movement-based metrics like distance travelled do not apply to these categories.
Does this apply to rented and subcontractor equipment, or only owned assets?
The same category-based measurement standard should apply regardless of who owns the equipment. On multi-subcontractor sites, that consistency is what makes it possible to compare utilization honestly across owned, rented, and subcontractor machines rather than accepting whatever reporting each subcontractor happens to provide.
How is a target set for each equipment category?
Targets are built from that category's own historical performance in a comparable operating context, then shown as a visible benchmark against the category's current average, so a fleet manager sees an above-target or below-target result rather than a raw number they have to judge on their own.
What happens to equipment that has no distinct productivity metric defined?
For a small number of equipment types, no output measure beyond utilization is currently defined. In those cases, utilization, measured correctly, remains the best available productivity signal until a more specific metric is developed for that category.